
LMS Alternative
Acadia makes training & learning faster
It also makes it stick!
Easy to Create Content and Deploy to Teams
From new employee onboarding to one point lessons and micro learning, Acadia helps your teams learn fast.

Easily create training materials and make them easily available – on any device and in any environment
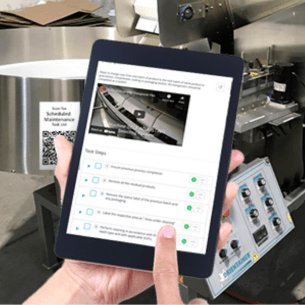
Include job aids that help employees do the right thing safely and easily – the first time and every time

Reinforce training with quizzing and evaluations to ensure every employee gets the support they need
An LMS Can’t Do That!
Training delivered at the point of use means a shorter path to results.


Watch Your Changes Make a Difference in Real Time
Combine your operational data with Acadia employee performance data and watch in real time as they improve.
Common metrics we’ve helped improve:
- New hire time to proficiency
- Waste, quality, and downtime
- Order to Cash and other financial processes
- Audit results – internal, client, and regulatory
- Improved on-time shipping and inventory management
Employee Retention ROI Calculator
Our clients see a minimum average improvement in employee retention of 20%. This calculator uses industry average cost per hire and turnover to calculate ROI of a 20% improvement.
Enter Your Details
With Acadia
Calculated Current State
*Rate of turnover by industry from 2018 Salary.com Turnover Report. Cost per hire by industry from 2017 SHRM Customized Talent Acquisition Benchmarking Report.
**These calculations were developed based on research performed before the current workforce shortage, which is driving up these costs across the board.
.
See Acadia in action, ask for a demo
"*" indicates required fields